Welcome to the ultimate guide for MySQL issues debugging — your comprehensive MySQL checklist for tackling MySQL database environment challenges. This checklist for MySQL debugging is as useful to a MySQL database consultant as it is for someone seeking remote support.
This MySQL Debugging Checklist, outlines steps and tasks crucial for identifying and resolving MySQL issues. It aims to provide you with the guideline of what-to-look-for and where without missing points.
This checklist is not only beneficial for MySQL database consultants but also for those seeking remote support should be able to provide the checklist information to the consultants to provide their inputs.
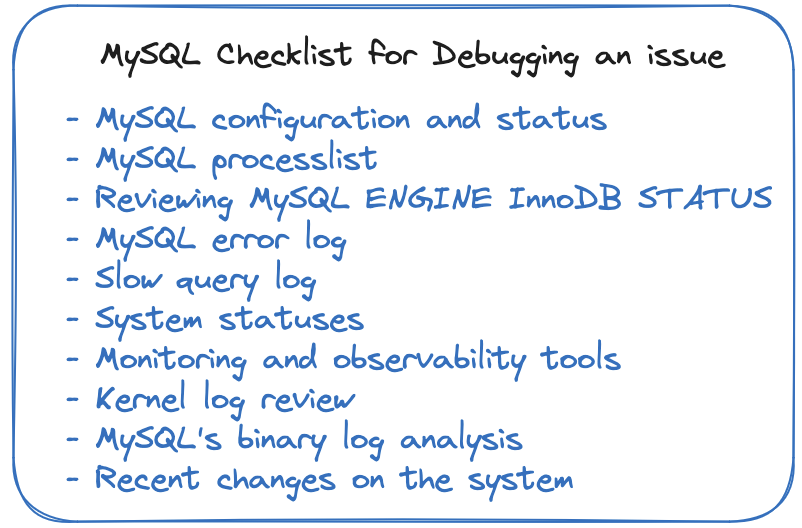
MySQL checklist for debugging issues
- MySQL configuration and status
- MySQL processlist
- Reviewing MySQL ENGINE InnoDB STATUS
- MySQL error log
- Slow query log
- System statuses
- Monitoring and observability tools
- Kernel log review
- MySQL’s binary log analysis
- Recent changes on the system
Consider using the list to provide assistance to debug and resolve the MySQL issues, not necessarily in the exact order. The list here is not exhaustive and may need further points to consider for resolving the possible performance or stability issue in MySQL.
MySQL Checklist details
MySQL configuration and status
Checking the MySQL status and uptime provides an overview of the server’s health and availability.
# Sample Command:
mysql> status
The “status” command will provide you with the uptime with additional information. This is where you can also find the MYSQL version which is important to understand what are you dealing with 🙂
Usually, MySQL configuration variables and statuses can be collected in a file as noted below and can provide additional information:
mysql -e "show global variables;" > variables
mysql -e "show global status;" > status
pt-mysql-summary – is the tool that can also help you collecting and identifying the MySQL statuses and variables in well formatted output.
MySQL processlist
MySQL processlist indicates the operations currently being performed by the set of threads executing within the server. A MySQL consultant would like to analyze the MySQL process list in order to identify slow or stuck queries that might be affecting overall performance.
# Command
SHOW FULL PROCESSLIST;
You may want to get fancy with the “grep” – some of the following commands will help you get an analysis from processlist.
# Ignore all the Sleeping connections
pager grep -v Sleep; show full processlist;nopager;

# Command-wise counts
select command, count(1) from information_schema.processlist group by command;

# Queries count being executed per query text:
select substring(INFO,1,100) query, count(1) from information_schema.processlist group by substring(INFO,1,100);

# Queries count being executed per host:
select substring_index(host,':',1), count(1) from information_schema.processlist group by substring_index(host,':',1);
Reviewing MySQL ENGINE InnoDB STATUS
The Engine InnoDB Status displays extensive information from the standard InnoDB Monitor about the state of the InnoDB storage engine. Examining the InnoDB status reveals valuable information to the MySQL database consultant about transactions, locks, deadlocks, semaphores, history list length, and many other InnoDB engine statuses.
SHOW ENGINE INNODB STATUS\GMySQL error log
The MySQL error log provides the diagnostic messages such as errors, warnings, and notes that occur during regular operations. It is a usual place for MySQL consultants to look for while debugging an issue. Reviewing error log helps MySQL database consultant by assisting in identifying critical errors / warnings or notes possibly that may relate to the ongoing performance or stability issue.
mysql> select @@log_error # Identify MySQL’s error logIf the server is unable to start, you can get the path from the config file
$] grep -i error /etc/my.cnf
$] sudo tail -100 /var/log/mysql/error.log
Slow query log
Enabling the slow query log allows identification of queries that take longer to execute, helping optimize performance.
Sample Command to enable slow query log:
SET GLOBAL slow_query_log = 'ON';
SET GLOBAL long_query_time = 0; # Collect all the queries
The Query Digest to debug query performance
pt-query-digest tool is used to analyze MySQL queries from logs(slow / general / binary), processlist, and tcpdump. When executed on a MySQL slow query log, it generates a detailed output, summarizing key metrics. The output includes an overview of the total number of queries, the percentage of slow queries, and a breakdown of query types. It identifies query classes based on fingerprints, offers examples of slow queries, and provides insights into query sources. Additional sections cover query profiles over time, response time distribution, percentiles, and lock time analysis. The tool’s output assists database administrators in identifying performance bottlenecks, understanding query patterns, and optimizing overall MySQL database performance.
Data to analyze Slow queries, Table definition, indexes, table size / status
A MySQL database consultant will require an explain plan, table definitions, and indexes to help identify potential optimization in the slow query.
# Query explain plan:
EXPLAIN <query>;
# Table Definition:
SHOW CREATE TABLE table_name\G# Indexes:
SHOW INDEXES FROM table_name\G# Table Size/Status:
SHOW TABLE STATUS LIKE 'table_name'\GMonitoring and observability tool
Utilising monitoring tools like Percona’s PMM, Prometheus, DataDog or other alternatives ensures real-time performance monitoring, allowing administrators gain valuable visual insights into the database’s behaviour.
This visual representation is instrumental in pinpointing performance bottlenecks, understanding query or traffic patterns, and making informed decisions to optimize MySQL database performance. Depending on the configuration, you can also see some historical data to gather more insights about the database behaviour.
System statuses
Monitoring system metrics like uptime, disk usage, memory, and CPU provides insights into resource bottlenecks and helps identify potential hardware-related problems. Of course the same metrics can also be observed through the monitoring tools like PMM.
Some of the commands on Linux OS should be useful to collect necessary information:
  uptime
  df -h
  free -h
  top
  sar
  vmstat
  iostat
The Percona tool, pt-summary will help summarising system information nicely and should also come in handy to the database consultants to review.
Additionally, I’d also mention Percona Toolkit’s pt-stalk. The tool, pt-stalk, can be run directly or configured to execute when a trigger condition occurs, then it collects data to help diagnose problems. The diagnostics data are stored in a file which can help consultants by providing additional information along with timestamps.
Kernel log review
Analyzing the kernel log helps identify system-level issues, such as hardware failures or kernel panics, OoM kills, which could impact MySQL’s stability. You may check system messages:
Sample Commands and files required to review Kernel logs
dmesg
/var/log/messages
/var/log/syslog
MySQL’s binary log analysis
Analyzing the binary log helps track executed commands, assisting in identifying issues related to data changes or replication.
mysqlbinlog --no-defaults --base64-output=decode-rows -vvv <BINLOG_FILE> > binlog.debugRecent changes on the system
At times the MySQL issue can also be related to the recent changes, upgrades or additions on the packages. Checking for recent system changes, like software upgrades or application updates, helps pinpoint the source of issues.
# rhel / centos
sudo yum history list
sudo yum history info <transaction_id>

# debian based
less /var/log/apt/history.log
less /var/log/dpkg.log
Conclusion
Having a MySQL debugging checklist information readily available is invaluable when tackling MySQL issue or seeking assistance from a database consultant. It provides the database consultant with essential details, enabling a quicker and more accurate identification of potential MySQL problems.